
|
XSdetect Nano implements a type of performance
indicator called the Energy Performance Coefficient.
EnPC is the ratio between actual and expected
consumption (with 'expected' consumption in this
case refering to what would have been expected
under baseline performance conditions). EnPC starts with a value of 1.00 and a reduction signifies improved energy performance. | |
| The general appearance of the Energy Performance Indicator report is as shown here. Up to 20 individual elements of the organisation can be reported, with a grand total at the foot of the report. The report can span as many reporting intervals as required (subject to the availability of data) and the calculation is designed to tolerate unavailable data. |

|
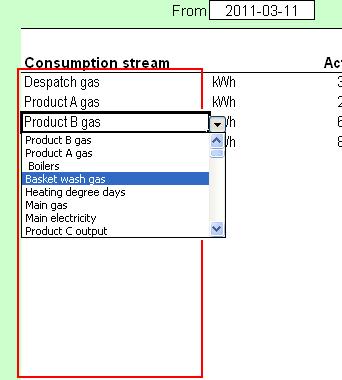
| To set up the report, first select which consumption streams should be included. You must choose them from the drop-down lists, and they must be streams for which there is a calculation of 'baseline' expected consumption (i.e., non-zero values in rows 12-14 of the Souce Data worksheet). Your selection will be preserved when you save the workbook, but if you upgrade to a later version you will need to rebuild it or paste the list from the earlier version. |

|
|
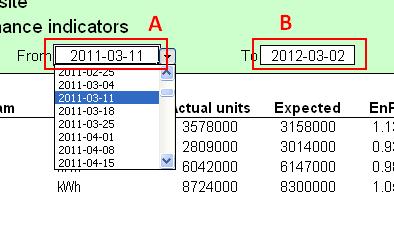
You can now set the required span of the report
by selecting a starting (A) and finishing interval (B).
'Intervals' may be daily, weekly or monthly, depending
on the contents of your source data table.
The span of the report includes consumption in the starting interval (A). Therefore it is possible, for example, to set the two dates equal: this will give a report for the individual interval. If the finishing interval precedes the starting interval, the date boxes will turn red. |

|
|
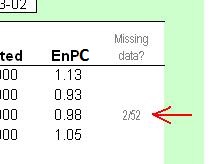
If the consumption data contains missing items (indicated
by #NA values), the report will show how many
items are missing. It will estimate consumption
by extrapolation from known values.
Warning: the calculation allows for missing data in driving factors but assumes that the same periods are affected in both the consumption and driving-factor data. If this is not the case, greater error will be introduced. |

|