Reporting exceptions

Overview | Source data | Performance indicators | Analysing performance | Charts | Reporting exceptions | Settings
The overspend league table shows the apparent excess costs in all the consumption streams for which targets have been set (see the step-by-step-guide ), and for which a price per unit has been recorded in row 9 of the source data table. The report refers to one assessment interval (day, week, etc., according to what is recorded in the source data).

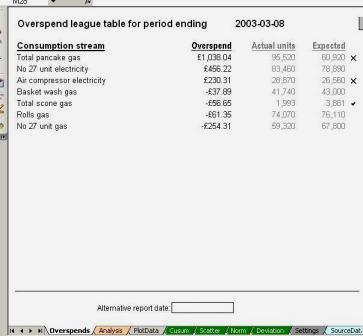
Items are automatically listed in descending order of excess cost, so the most overspent item is always at the top of the page.

In cases where the deviation from expected consumption exceeds the control limit, an indicator is shown on the right-hand margin of the report. A cross (x) indicates unusually high consumption and a tick () unusually low consumption.

The report shows up to 20 entries.

By default, the report automatically shows results for the most recent available data. To revert to any earlier interval, click on the 'Alternative report date' box at the foot of the page and select the date you require

You can revert to the most recent interval either by selecting it from the drop-down list, or by blanking out the 'Alternative report date' box.