|
The data source worksheet initially contains
sample data, which you should erase and replace
with your own data.
You must populate the worksheet provided,
and not replace it with one of your own, because
the built-in worksheet contains conditional
formatting and a named range which is essential
for correct operation. It is safe to use
copy-and-paste operations for this purpose.
|
Layout rules
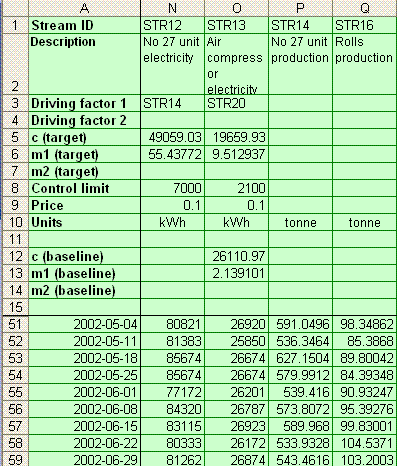
The top 50 rows of the sheet are reserved for fixed
information and rows 51 onwards should be populated
with your consumption data, driving factor data
(production, degree-day values and so on), and any
intermediate calculations that you need.
|
- Column A should contain datestamps, starting from row
51. Datestamps must not be present in rows
without data. The 'yyyy-mm-dd' format is strongly
recommended because it is used elsewhere in the software
to help with portability between regions.
- The table can contain data at any regular interval:
daily, weekly, or monthly for example.
- There must be nothing in the worksheet
below the last row of available data. If cells below
the data table are occupied, XSdetect Nano will not be
able to locate the end of the useable data.
- Only the first 100 columns of the Source Data
worksheet should be used. Data in columns CW onwards
will not be visible to XSD Nano's calculations.
|

|
Fixed information (rows 1 to 50)
Note: Rows 1 to 50 are reserved for
fixed information relating to the data in each
column of the table. However, for readability,
only the first 15 are normally visible.
The hidden rows can be revealed by unfreezing the
worksheet windows.
The following information is recorded:
- Row 1: Stream ID
A unique identifier for the data in the column.
Only required if the data are likely to be invoked
as driving-factor data
- Row 2: Description
This text is used in the drop-down list of items
for analysis, and as labels on charts and reports
- Row 3: Driving factor 1
Stream ID of the main driving factor
- Row 4: Driving factor 2
(for future version)
- Row 5: c (target)
Intercept of the target expected-consumption line
on the vertical axis of the scatter diagram
- Row 6: m1 (target)
Slope of the target expected-consumption line
on the scatter diagram
- Row 7: m2 (target)
(for future version)
- Row 8: Control limit
Normally-observed limit ot variability between
actual and expected consumption
- Row 9: Price
Price per unit in the chosen reporting currency
- Row 10: Units
Units of measurement for the data in the column
- Row 11: spare
- Row 12: c (baseline)
Intercept of the baseline expected-consumption line
on the vertical axis of the scatter diagram
- Row 13: m1 (baseline)
Slope of the baseline expected-consumption line
on the scatter diagram
- Row 15: m2 (baseline)
(for future version)
- Row 16: spare
|


