Now we switch to the Analysis sheet:

In the Analysis of box we pick 'No 25 Unit Gas' from the drop-down list:

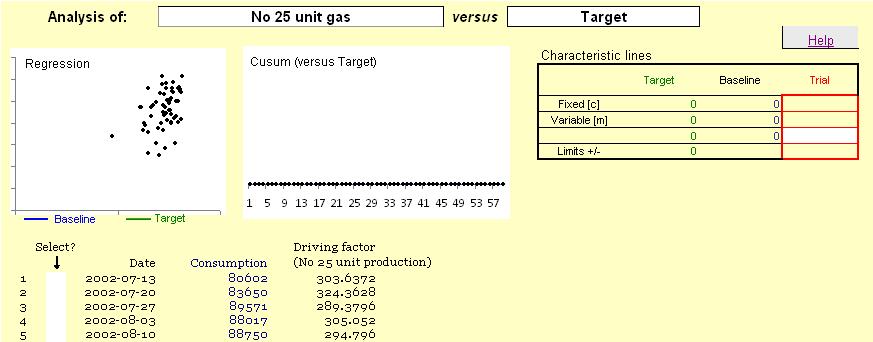
The data columns on the sheet are now populated with the gas consumption and production output figures. The scatter diagram (on the left) shows the relationship between them as a set of points: