In this example we see from the cusum chart that there is a sustained period of very favourable performance near the end of the chart (indicated by the steep downward slope). Let us use this period as the basis for future performance targets.
We select the favourable points by typing any text in the 'Select?' column for those rows only:
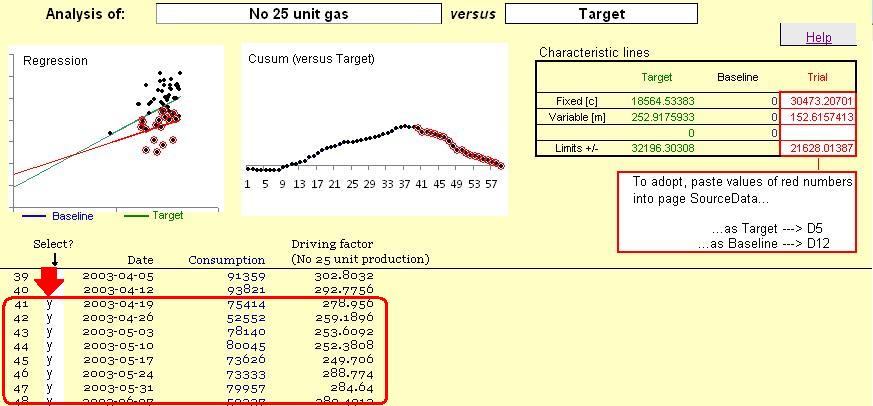
Hint: as you type, the selection will change on the preview charts above the table, and you can add or remove points to fine-tune your selection. But remember you can also view the full-sized cusum chart to help identify the correct range.